In an attempt to mitigate excess speeds on the roads within the village the Parish Council has invested in 8 VAS units. These have been positioned strategically around the village’s road network, focussing primarily on entry points to built up areas. Their primary functions are to supply a visual indicator to remind drivers of the speed limit, and also act as a psychological cue to modify their driving behaviour whilst within the parish. The devices are calibrated to trigger a visual display at 25 MPH and above. They utilize a radar beam which detects vehicles approaching and leaving the unit (bi-directional data capture). All units record the data collected, which includes: vehicle numbers, speed, direction of travel and a time and date stamp. This data is downloaded on a monthly basis, analysed and used to compile a breakdown of activity on our roads. This is published for residents to scrutinize as well as forwarded to Beds Police and Beds Borough Council to encourage their engagement with us in addressing excessive speeding on our roads - we recently had PC Thompson in the village undertaking an enforcement operation on the strength of our submissions. The information we are generating from these devices is also useful in supporting our requests for Average Speed Cameras for Ravensden Road. Additionally, Renhold’s Community Speed Watch team have been given permission by Beds Constabulary to utilize the devices for recording speeds when performing their monitoring activities
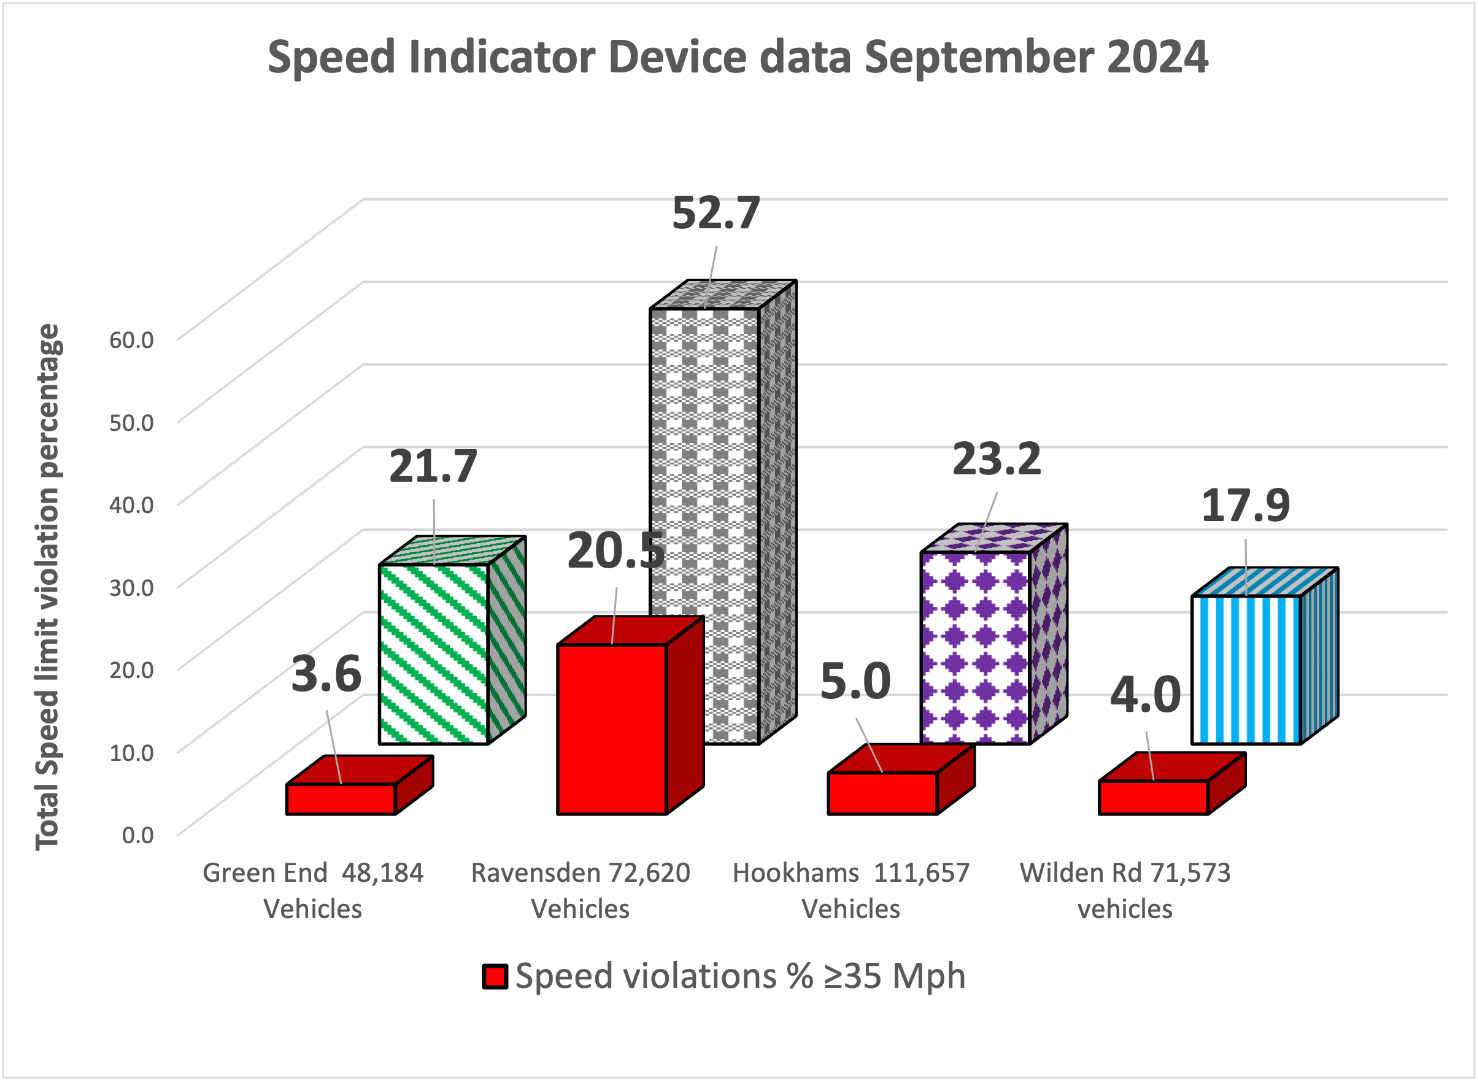
Speed Indicator Device data summary for September 2024 | |||||
| Total Vehicle Movements | Violation % |
| ||
| |||||
Ravensden Rd (Ravensden) | 72,620 | 52.7 |
| ||
| |||||
Percentage of total recorded speed values ≥35 mph = 20.5% = 14,917 vehicles | |||||
35-39 mph = 12,062 vehicles 40-44 = 2,230 vehicles 45-49 = 469 vehicles ≥50 = 156 vehicles |
| ||||
| |||||
| |||||
| |||||
| |||||
Hookhams Lane (Home Close) | 111,657 | 23.2 |
| ||
| |||||
Percentage of total recorded speed values ≥35 mph = 5% = 5,621 vehicles | |||||
35-39 mph = 4,702 vehicles 40-44 = 727 vehicles 45-49 = 140 vehicles ≥50 = 52 vehicles |
| ||||
| |||||
| |||||
| |||||
Green End (Top End) | 48,184 | 21.7 |
| ||
| |||||
Percentage of total recorded speed values ≥35 mph = 3.6% = 1,756 vehicles | |||||
35-39 mph = 1,571 vehicles 40-44 = 158 vehicles 45-49 = 23 vehicles ≥50 = 4 vehicles |
| ||||
| |||||
| |||||
| |||||
Wilden Rd | 71,573 | 17.9 |
| ||
| |||||
Percentage of total recorded speed values ≥35 mph = 4.0% = 2,856 vehicles | |||||
35-39 mph = 2,469 vehicles 40-44 = 325 vehicles 45-49 = 56 vehicles ≥50 = 6 vehicles |
| ||||
| |||||
| |||||
| |||||